Anaplan Use-Case 4: Linear Interpolation
Linear Interpolation is a mathematical method used to estimate values between two known numbers. While not common, it does occasionally pop up in business planning. The upcoming article focuses on a specific use-case involving Linear Interpolation.
NOTE: This article is a segment of the Anaplan Use-Cases Series. If you haven’t already, I encourage you to read through the introductory blog Why Anaplan Use-Cases Series? to understand the background behind this endeavor.
Context
A hypothetical pharmaceutical company Bio Well markets and sells drugs to counter imbalances of nutrients in human body to achieve long-term wellness. Bio Well successfully launched an anti-diabetic drug a few years ago. If an adult human takes one pill a year, he/she can, very well, keep any existing/potential diabetic problem at bay, without any side effects.
Every year end, the Sales, Marketing, and Manufacturing departments seek R&D department’s help in estimating quantity of anti-diabetic drug required for 9 future years, so that they can prepare for required personnel and infrastructure to support the expected future supply.
It is the month of November 2024. The R&D department already has information about the Total Addressable Market (TAM) for 9 future years in each of the countries the firm operates in.

R&D Head gets partial market share information from the sales and marketing departments.
1) Actual market share (for the year 2024) from the sales department, and
2) Expected market share (for the year 2033) from the marketing department.

R&D department has been tasked to fill in the intermediate years (2025 through 2032) with an assumption that the company can linearly increase its market share each year to reach the target set for 2033, setting up stage for a classic linear interpolation problem.
With TAM and Market Share information for 9 future years, R&D Head can then project Customer Base for the upcoming years, and hence, the supply of anti-diabetic drug Bio Well needs to provide and support for.
Customer Base = TAM x Market Share

User Story 1
As R&D Head, I need to input Market Share for the current year and 9th future year, so that the system can linearly interpolate information for the intermediate years (8 future years).

User Story 2
As R&D Head, I need the system to linearly interpolate the market share of all the intermediate years, so that we can project the customer base for the future years later.

Analysis & Design
User requirements call for user input and linear interpolation of market share information.
In an ideal world, if Anaplan permitted, it would be great to see the user input values under first and last years in a data grid and the system populate (interpolate) values for all the intermediate years in the same data grid. However, in the real world (of Anaplan), we cannot force a line-item to accept both user input (for some years) and calculated values (for the other years). The line-item can either be formula-based or user input, but not both. Hence, we need to create two different line-items — one for the user input and the other for the calculated (interpolated) values.
For linear interpolation, we would need to subtract the first value from the last value and divide the difference by the number of intervals between the two years (i.e., 9) to get the increment amount. For example, the increment amount for USA is 4.44%, as shown below.

The increment amount would then be added to the value of the prior year to compute the value for the given year.

The simplest way to extract market share values for the first and the last years is through the TIMESUM function. While TIMESUM is usually used for aggregating a measure across TIME dimension, it can also be used to extract a value off a specific time-period. To solve the problem at hand, we intend to leverage the latter not-so-well-known power of TIMESUM.
Implementation
For linear interpolation, we start off with a simpler solution and see if it has any drawbacks.
a) We create a time range ‘CY + 9FY’ to include 9 future years along with the current year (2024).
b) For User Story 1, we create an input module for registering user inputs for the first and the last years in a line-item ‘Input %’.
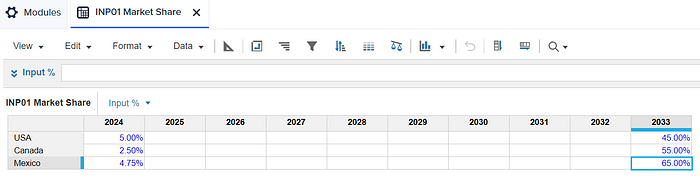
c) For User Story 2, we create a new module (with Country list, but without TIME dimension) and extract first and last year’s market share values to calculate increment amount for each country.

First Value: TIMESUM(‘INP01 Market Share’.Input %, 0)
Last Value: TIMESUM(‘INP01 Market Share’.Input %, 9)
Increment: (Last Value — First Value) / 9
Notice the use of TIMESUM function to extract value off a specific year. We specified the time-period index as 0 for the first year and 9 for the last year. We also hardcoded the number of intervals as 9 in the formula of Increment line-item.
However, the solution (with hardcoding) works well until the time range is not changed. If the business users decided to lengthen/shorten the planning time range (9 future years), all the hardcoding (0 or 9) would need to be changed accordingly, else the increment value (and hence, the interpolated numbers) would be calculated incorrectly.
For a more robust solution, we need to remove the hardcoding.
d) Create a TIME system module (‘SYS01 TIME’) for the time range ‘CY + 9FY’ and assign an index to each year — ‘Year #’.

e) Create a dimensionless system module (‘SYS00 General’) to extract the indices of first and last years and compute the number of intervals between them.
First Year #: TIMESUM(‘SYS01 TIME’.Year #, -100, 100, MIN)
Last Year #: TIMESUM(‘SYS01 TIME’.Year #, -100, 100, MAX)
# Intervals: Last Year # — First Year #

f) Then, we go back to the module ‘CAL01 Market Share Increment’ and remove all the hardcoding.
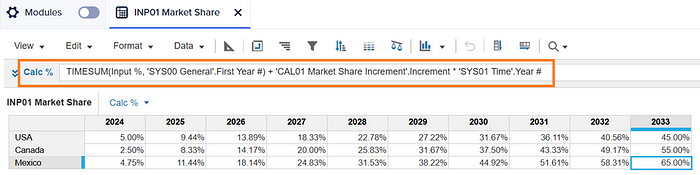
First Value: TIMESUM(‘INP01 Market Share’.Input %, ‘SYS00 General’.First Year #)
Last Value: TIMESUM(‘INP01 Market Share’.Input %, ‘SYS00 General’.Last Year #)
Increment: (Last Value — First Value) / ‘SYS00 General’.# Intervals

Bingo! Now, if the requirements changed, we would just need to update the number of years of the time range — everything else would work automatically.
g) Now that we have increment amounts for each country, we go back to the module ‘INP01 Market Share’ and calculate the interpolations in a new line item (‘Calc %’), concluding the work for User Story 2.
h) Before we conclude the development, there is one more thing we could do. For User Story 1, we could enhance the user experience by not allowing the user to be able to input numbers against the intermediate years — moreover, they wouldn’t be of any use anyways. We achieve this by first creating a few Booleans in the TIME system module.


i) Then, we set up DCA (Dynamic Cell Access) in the input module using the Boolean ‘Fringe Year?’ off the TIME system module.

Conclusion
While a solution might be simple and quick to implement, we need to ask ourselves whether it is easier to change if user requirements evolve over time. Only then can we take appropriate measures and guarantee a more stable, sustainable and auditable system for the users.
Remember that TIMESUM can be used for two different use cases — the usual setting is when we aggregate across TIME dimension and the less common scenario is when we need to extract value off a certain time period.
